

As part of the Gullspång salmon and -trout monitoring program, a group of people from the management group, Gammelkroppa Lax and Jyväskylä University/Fortum perform redd surveys in the river every year in early December. The salmon and trout in the Gullspång River spawn fairly late in the season, first trout in October-early November and then salmon in November until around the beginning of December.
This year I was invited to assist in the redd surveys, which I of course said yes to! Any chance to learn more about the Gullspång salmon and -trout is valuable for the model I’m making. Plus, it’s nice to get out of the office, even when the temperature is close to zero. And it’s also very inspiring to meet other people who are studying the Gullspång salmonids.
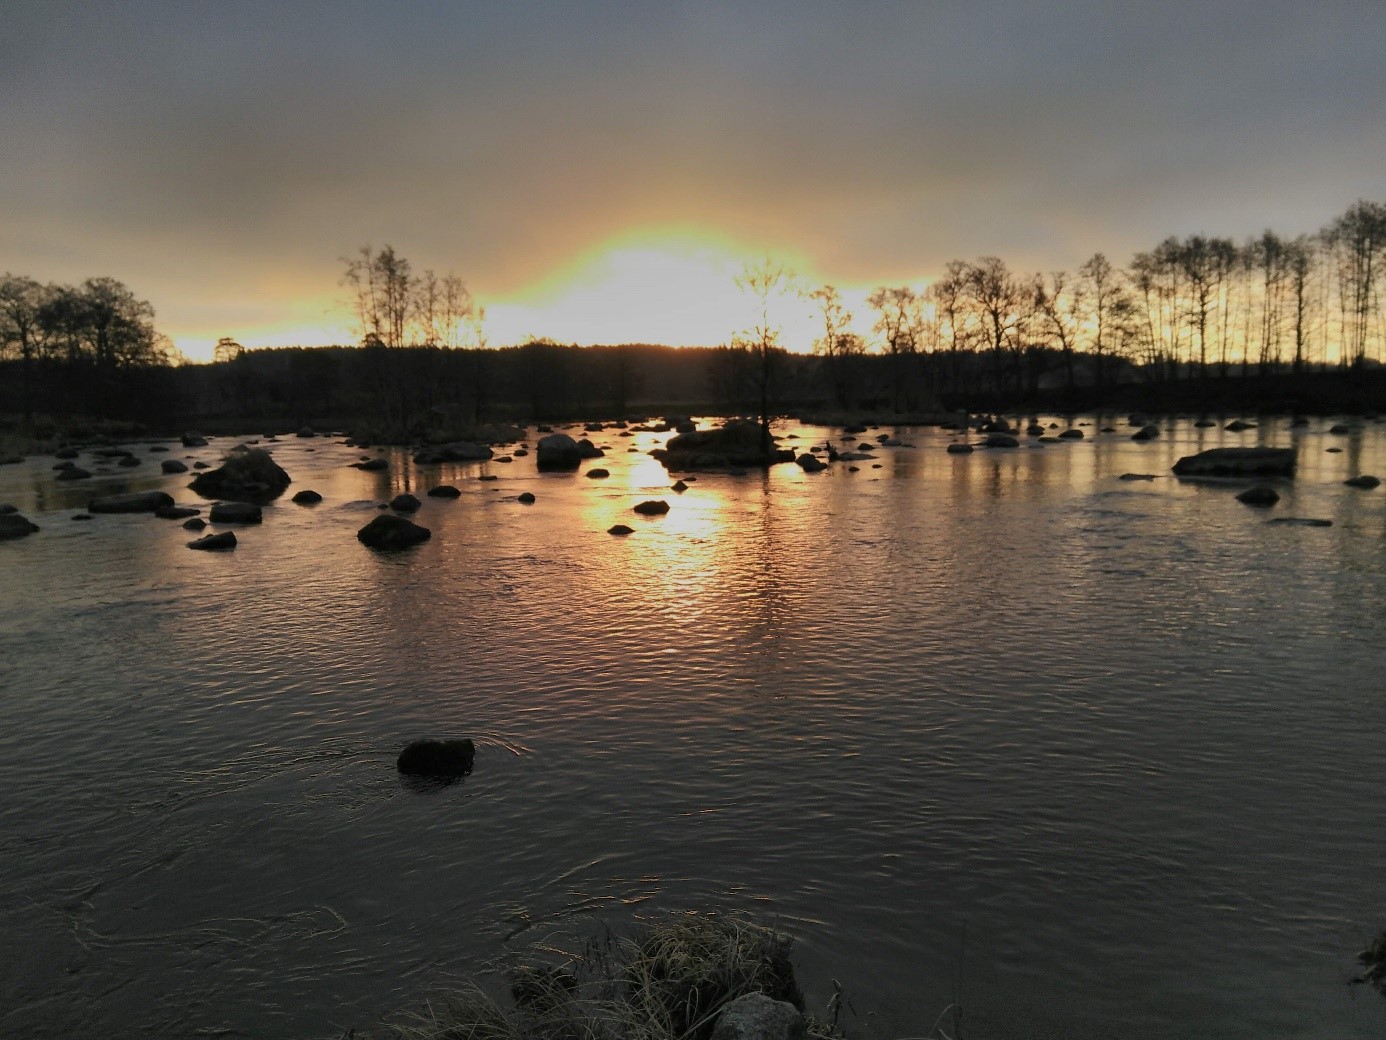
Lilla Åråsforsen. With sunrise at around 8:30 and sundown at 15:30, we had to be efficient to cover the three areas (about 6.4 hectares) in the precious daylight hours the four days.
So, we started by the Årås bay (Åråsviken) on Tuesday, and slowly worked our way upstream. With layers upon layers (upon layers…etc.) under our waders, and thick, wadded rubber gloves we walked gracefully around in the three spawning areas – Lilla & Stora Åråsforsen and Gullspångsforsen- to look for anything that could be a fish-made structure in the gravel beds. Sometimes we had redds that looked like textbook examples of redds, other times they didn’t look like anything. To confirm or disprove that it was an active redd, we did some careful digging in the pit itself to see if it contained at least two live eggs. The females often do some test diggings before the “real deal”.
We marked confirmed redds with conspicuously colored stones so that they can be found again in the spring; their location was also mapped with a GPS. Initially, we started with Finnish marking stones, but to our slight surprise they ran out (see why further down). We therefore had to settle with slightly lighter Swedish stones the last few days. Sadly, Norway was not represented with any stones (but we’ll see next year).
We also took measurements of the dimensions of the redds, as well as the depth and velocities along the gradient between start of pit and end of tail. I quickly took the role of propeller lady, taking the flow velocity measurements with NRRV’s OTT meters. It was interesting to see how much higher the velocity generally was in the tail compared to in the pit.
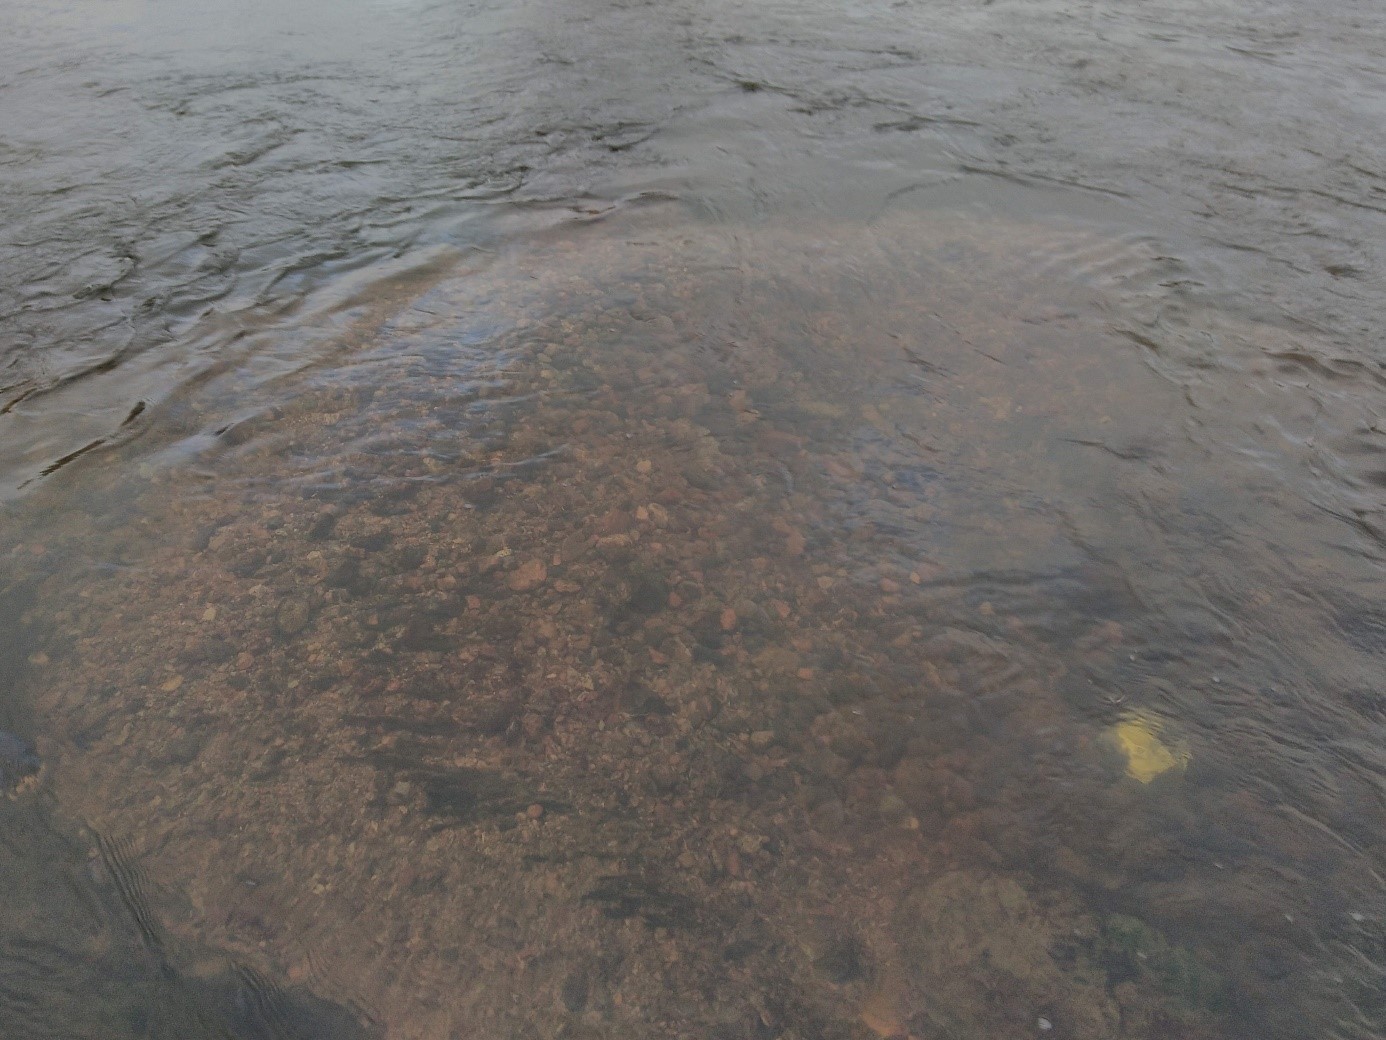
Horseshoe-formed tail of a large redd in Lilla Åråsforsen rapids marked with a white-painted and numbered stone. The marking stones were bought from a local stone dealer in Finland and brought to Gullspång.
I’ve saved the best for the end: the reason why we kept running out of marking stones was that we counted a record number of redds this year! We found redds also where they usually are not found, in total around 190 of them! It’s a careful victory, because we don’t yet know how many of them are salmon respective trout redds. But it was a nice early Christmas present, and I’m glad I joined!
Learn more:
Management report on the monitoring results on Gullspång salmon and –trout in 2017:
Salmon females design their redds in a sophisticated way to increase velocities and dissolved oxygen to the egg pockets as shown with a 3D fluid dynamic model: