


This post covers chapters 18, 19 & 20 from Futuyma and Kirkpatrick’s book on Evolution (2018). The author of this post is Jacqueline Hoppenreijs.
We’ve heard all about the appearing and disappearing of species and species groups on and off the Earth’s surface over the past billions of years…So now it’s time to see how these are linked to the changes that the very surface itself has seen and zoom out a bit, both in space and time!
The geography of evolution
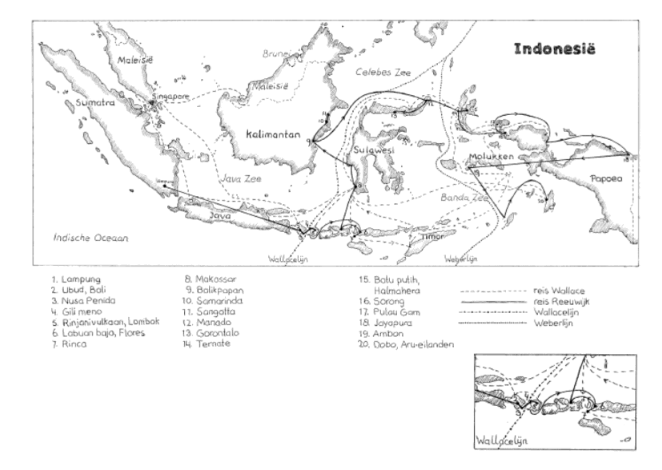
Linking the geographical distribution of species to their ecology is called biogeography, a field that started with the extensive travels of Alexander von Humboldt. He was one of the first to try and figure out why a species occurs in one place but not in another, leading to research on the traits that enable species to live in specific places, measurements of environmental characteristics and, eventually, species’ evolutionary history. Charles Darwin, who was an enormous fan of Von Humboldt (Wulf, 2015), was the first to describe how physical barriers lead to different species occurring in different places, and how similar traits develop if those places are similar. While he was exploring South America, his colleague Alfred Russel Wallace made similar discoveries in south-eastern Asia and Oceania. Following that, Wallace developed a model of biogeographic realms: regions that are inhabited by similar plant and animal taxa. Knowing about the Earth’s geological history, one realises that the current geographical distance between localities is far from the best predictor for ecological similarity of species communities. The realms Wallace himself studied most intensively were the Oriental and the Australian lines, separated by what’s now best known as the Wallace line (Figure 1). The islands of Bali and Lombok, separated by this line, are no more than 50 km apart these days, yet the species groups that inhabit the respective islands are different. The Indomalayan biogeographic realm on the west is maybe best known for its large mammals, such as the Javan rhinoceros and Indian elephant, and its diversity in pitcher plants. On the other side of the divide, the Australian realm is known for marsupials, birds of paradise and eucalypts. There are, however, multiple interpretations of potential lines, of which the Weber line probably is the best-known alternative (Simpson, 1977).
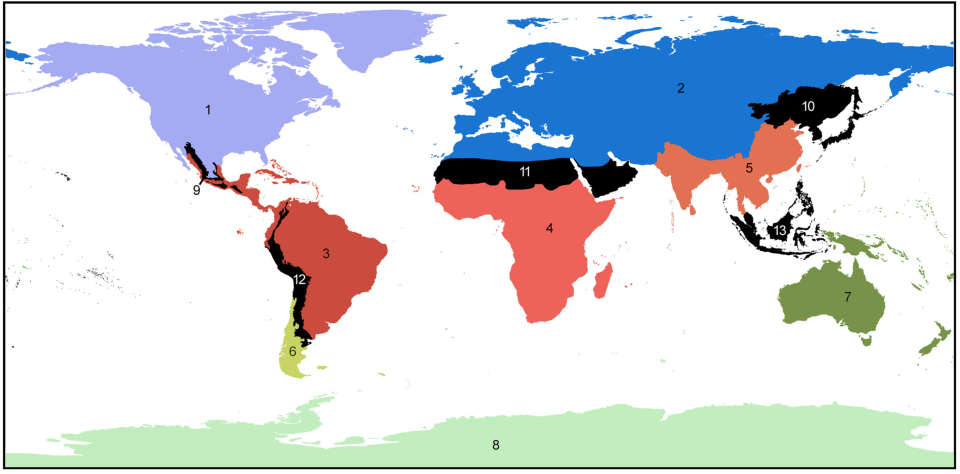
We’ve previously learned about how geographical barriers shape species distributions. While Humboldt, Darwin and Wallace were forced to work with species descriptions and phenotypical measurements, scientists these days have a much wider array of methods at their disposal to map the historical processes of past and current species distributions. The main processes driving these distributions are dispersal, which we have seen can be gradual and look like a stepwise species distribution, and vicariance. Dispersal patterns can, however, also look like giant leaps, for example when a few individuals cover a large distance and start a new population far away from their homes, or when dispersal happened gradually but populations between the two ends of the distribution have been wiped out and gone extinct. This geophysical separation is a form of vicariance, the process that leads to disjunct populations, and often comes in the form of climatological or tectonic disruption. With an increased understanding of plate tectonics and technologies to research fossil remains and build phylogenetic trees, scientists are now able to map the processes driving species distributions better than ever. Our better understanding has led to there being multiple and more nuanced angles to the debate around biorealm delineation, and the general acceptance of there being at least some type of transition zone (Figure 2; Morrone, 2023).
The current distributions of species are a result of these historical processes and current circumstances. The limits of their ranges are decided by several factors, of which dispersal is again an important one: how well is the species able to spread to new areas? That doesn’t only concern the activity itself, but also whether the species finds a mate in this new area (if it depends on sexual reproduction) and how well the species is able to settle in. That means that it needs to be able to find its ecological niche, or in the case of eco-engineers at least to the extent that they can modify it further to fit their requirements. The fundamental ecological niche is the set of abiotic and biotic conditions in which a species finds its most basic needs met, although it might not be the most favourable place. That means that a species A that has its optimum temperature at 17°C but tolerates temperatures between 14 and 24°C, has a niche width of 10°C. Take a species B that thrives at 21°, however, and this species B might outcompete A out of the “upper” part of its fundamental niche. A’s realised niche is thus narrower because of species B, which illustrates the competitive exclusion principle. While this sounds like a relatively modest consequence for species A, it doesn’t sound like a fringe issue at all when you think of the enormous shifts in temperature that the climate crisis causes. Lajeunesse and Fourcade (2023) analysed one of the world’s largest databases, GBIF, on nine different animal taxa and found that almost all of them now consist of species with higher preferred temperatures than 30 years earlier. Since species that are phylogenetically closely related often have similar niches (also called phylogenetic niche conservatism), this means that replacements can be with quite dissimilar species which in its turn can lead to drastic ecological turnovers. Add to the fact that temperature increases are not the only consequence of the climate crisis and the fact that Lajeunesse and Fourcade found that there’s a time lag of these effects too, and we’re looking at a serious problem.
The evolution of biological diversity
While it’s becoming painfully clear that we’re entering the sixth mass extinction (Cowie et al., 2022), it’s not quite as clear how large of an extinction that will be: we simply don’t know how many species inhabit Earth at this time! Current estimations lie between 2 and 8 million eukaryotic species, and we know that those are wildly unevenly distributed in space but also over taxa. It’s not quite clear what drives these differences, but if we’re taking a straightforward approach, we can start by counting species in each of these taxa. If we add information about speciation and extinction rates, we can reason towards a diversification rate, which tells us something about a taxon’s increase or decrease in species richness over time. Two different components of this equation (the time that the taxon has had to undergo diversification and the diversification rate itself), together with the carrying capacity of the system, can help us understand why some species groups are more species-rich than others. A similar argument goes for different areas since areas closer to the equator are usually more species-rich than areas on higher latitudes.
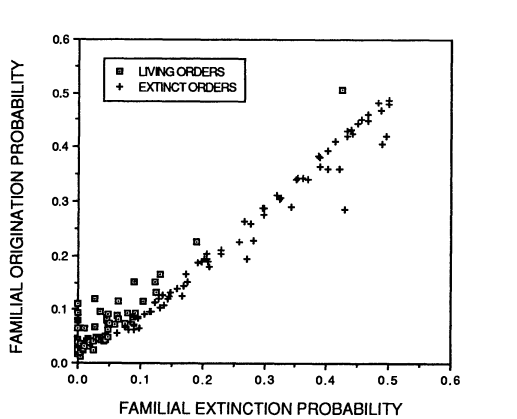
Archaeological records can be used to map past speciation and extinction patterns, and have led to the discovery of, among other things, the Cambrian explosion (which, while sounding violent and destructive, refers to a period of speciation instead of extinction) and previous mass extinctions. The aforementioned sixth mass extinction and its predecessors are not the only time that species or entire taxa became extinct: there is a usual background extinction rate that makes all geological strata potential sources of now-extinct specimens. Both this background extinction rate and the speciation rate have generally declined over the past hundreds of millions of years, and it’s not quite clear why. Especially extinctions should be random, and thus extinction rates quite constant since they depend on random environmental variation and natural selection. Alternative hypotheses are 1) species-rich taxa don’t count as extinct until all of the species within the respective taxa are indeed extinct, and right now we happen to have a lot of species-rich taxa, and 2) the taxa that undergo rapid speciation and extinction are mostly extinct now, and we’re left with the taxa that go through these processes more slowly. The second hypothesis builds on the fact that speciation and extinction rates of taxa are correlated with each other (Figure 3).
While scientists have found out that extinction rates are relatively constant per taxon, mass extinctions were everything but random: some taxa had better chances to survive than others. Their respective chances depended not on the usual factors, such as consisting of many species, being widely distributed and so on, but on specific characteristic X that allowed them to deal with the cause of mass extinction Y (or not, obviously). One could thus say that evolutionary change works on three levels here: there’s the level of change within species or even populations, the level above on which species originate and go extinct at normal rates a.k.a. species selection, and the final level in which mass extinctions reshape the whole landscape of flora and fauna.
Reshaping consists not only of the wiping out of large parts of species communities, but also offers the opportunity for species to take in the niches that newly opened up and that are relatively competition-free. Mass extinctions are often followed by higher speciation rates, especially if a key adaptation comes to life. Key adaptations are species characteristics that open up a whole new niche, think of the wings of insects that opened up the possibility of flight or lignin in plants that allowed them to build more sturdy structures and colonise land. Such adaptations can lead to increased speciation rates or even periods of radiation, which can result in bouncing back to a certain equilibrium of species richness. Whether such equilibria exist is, however, a topic of discussion, and certainly also depends on the spatial scales one looks at. Local richness can depend on regional richness and is to a certain extent limited by resource availability and competition levels, since higher species diversity tends to lead to lower diversification rates. If not a perfect equilibrium, these dependencies at least suggest a certain bandwidth wherein species numbers fluctuate. If we zoom out, however, we also see how new taxa take in open ecological spaces, suggesting ever-increasing diversity. With that, we can safely assume that there are at least some among us that will have an answer to the sixth mass extinction.
Macroevolution: evolution above the species level
As we have seen for extinctions and speciation, processes don’t always have to be gradual and through small steps. The same seems to be true for evolution: while many changes are small and gradual, there also seem to be sudden developments of characteristics. The field of macroevolution covers these and related questions, such as whether such leaps are as random as small mutations. Evolution above the species level, also called macroevolution, shows surprising parallels with evolution within species (microevolution).
Such parallels include intermediate steps on the level of whole taxa instead of single species; intermediate steps that lead to completely new life forms. Examples are the dinosaur fossils that had feathers long before their carriers were able to fly; these feathers were mainly for insulation. It was only when other characteristics, such as smaller body sizes, changed that we would see animals that started to resemble our modern birds. The same goes for mammals: the skulls that allowed for strong jaws and large brains developed step by step and can, due to the nature of the material, be traced back with the help of fossils.
Such fossils can help us fill the evolutionary gaps between related taxa, for example between whales and other mammals. Now-extinct intermediate species could display different degrees of being amphibious, reduced teeth or moved nostrils, and explain roughly how and when four-legged land mammals went “back” to the sea. Some steps that we know about now seem so large, that some rather call them leaps or saltations. Some researchers have even gone as far as calling the few surviving products of these supposed saltations “hopeful monsters”. Often, however, these monstruous leaps are merely lacking proof of intermediate steps in our fossil record.
All of these steps have something in common. They’ve either been an adaptation to the environment that its carrier could benefit from, or they’ve been a by-product of the adaptation or a random change that didn’t have negative consequences to the extent that they were selected against. The latter may also become beneficial characteristics, with changed circumstances. Adaptations sometimes follow behaviours, such as when species change their feeding behaviour, and can be shaped by modifications without a direct genetic basis during an organism’s development. The complexity of phenotypes that we see today is, to some, enough ground to say that a special someone or something has had a hand in creating all these so perfectly working organisms. Unfortunately for them, our understanding of past steps, both small and (seemingly) large, proves that complexity is no reason to assume creation, rather that complexity might be caused by passing time and adaptive evolution through natural selection. For those that need more convincing, the similar changes that we see evolve independently from each other when taxa adapt to similar living conditions should do the job. Such adaptations are similar in function but clearly have different evolutionary origins, and are called analogous. Their conceptual opposites, homologous adaptations are generally speaking adaptations that have different forms across taxa, but are inherited from a shared ancestor. Biological homology is a bit broader than this, as it includes any characteristic that develops through a similar developmental pathway, i.e. eyes or extremities.
As we now know, the rate of evolution can be wildly different over time, between taxa, and so on. It is measured as an amount of change, for example in a mean trait value, per unit of time. What is tricky about this calculation is that its outcome is usually high when measured on a short time interval, and low when measured over a long time. That’s because of the loss or reversal of newly acquired adaptations, but also because of the previously mentioned niche conservatism.
With so much knowledge about the past under our belt, dare we look into the future? It’s safe to say that the processes that have driven evolutionary change in the past will continue to do so, but their direction and the extent of their respective effects is less clear. It’s possible to discern trends though: changes in a certain direction, that, for example, can be measured through the aforementioned mean trait values. Traits that follow passive trends are equally likely to develop in either direction, whereas an active trend means that development in one direction is more likely than in the other. Trends can become passive or active in a certain direction because of individual selection, speciation or extinction rates and species selection. Two major trends that we can distinguish are those towards higher efficiency and higher complexity. The former can be measured in, for example, the amount of energy it takes to perform certain functions. The extent to which a species needs to be able to fulfil those functions, however, depends on its environment and life cycle, so comparing species and saying that they are better or worse adapted based on a specific trait is quite pointless. The latter, complexity, can be described through hierarchical levels in organisms. Think of our multicellular selves, with our nuclei and mitochondria, our many different types of tissues and the rich bacterial flora that populates our guts, while we are busy being a small part of our human society: certainly a level of complexity that was hard to find when the Earth was purely inhabited by unicellular life. Both levels of complexity and everything in between and beyond are found on our planet today, and there are plenty examples of loss of a kind of complexity in species. Even here goes the adage that it has to be profitable, or at least not too disadvantageous, to maintain complexity when circumstances change.
With these major trends in hand, can we predict what the future will look like? Natural science has shifted from viewing evolution as a kind of progress towards “higher” or “better” organisms (also called orthogenesis) to one where it is everything but a teleological process. That is not to say that there is no predictability at all. After all, we have quite a bit of information about the past and the planet’s status quo. This can help us sketch at least some framework for the nearest future, but it’s safe to say that anything further than that remains a question unanswered for the time being.
References
Cowie, R. H., Bouchet, P., & Fontaine, B. (2022). The Sixth Mass Extinction: fact, fiction or speculation? Biological Reviews, 97(2), 640–663. https://doi.org/10.1111/brv.12816
Futuyma, D., & Kirkpatrick, M. (2018). Evolution (4th ed.). Oxford University Press.
Gilinsky, N. L. (1994). Volatility and the Phanerozoic Decline of Background Extinction Intensity. Paleobiology, 20(4), 445–458.
Lajeunesse, A., & Fourcade, Y. (2022). Temporal analysis of GBIF data reveals the restructuring of communities following climate change. Journal of Animal Ecology, 92(2), 391–402. https://doi.org/10.1111/1365-2656.13854
Morrone, J. J. (2023). Why biogeographical transition zones matter. Journal of Biogeography, April, 1–6. https://doi.org/10.1111/jbi.14632
Reeuwijk, A. (2013). Reizen tussen de lijnen. Dwars door Indonesië met Alfred Russel Wallace. Atlas Contact.
Simpson, G. G. (1977). Too Many Lines; The Limits of the Oriental and Australian Zoogeographic Regions. Proceedings of The American Philosophical Society, 121(2), 107–120.
Wulf, A. (2015). The Invention of Nature: Alexander von Humboldt’s New World. John Murray.