


Literature Course on Evolution
Posted by Louis Addo | Literature courseThis post covers chapters 6 & 7 from Futuyma & Kirkpatrick’s book on Evolution (2018). The author of this post is Jeff Marker.
Phenotypic Evolution
One major key to understanding how evolution works is based on the genetical theory related to inheritance, selection, and fitness. Through phenotypic evolution, we will now examine the quantitative traits produced by those genetic mechanisms, how the environment affects such traits, and how those traits drive evolution. Simply put, a quantitative trait is a species phenotype that is measurable in a continuous way. Quantitative traits are controlled and affected by a combination of many different genes and the environment. For example, blood pressure in humans is a product of environmental factors such as available diet in combination with genes that control a complex system of fluids, hormones, and salts in the body. Quantitative traits vary between species, but, like most phenotypes, they tend to follow a normal distribution over the entire population.
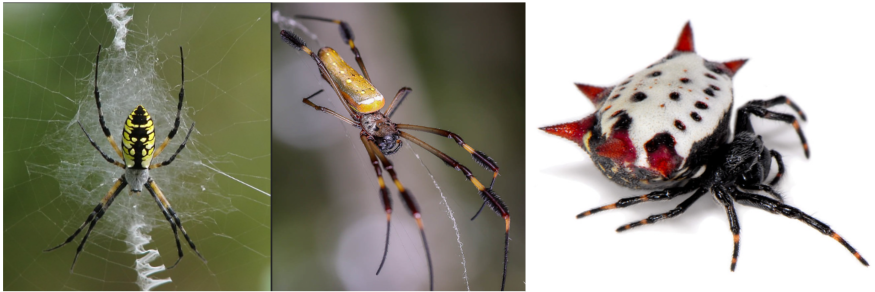
Natural selection acts on quantitative traits though the mechanism of fitness function where a specific trait of a species acts on its ability to survive or reproduce. There are three different types of selection associated with quantitative traits and fitness function: directional, stabilizing, and disruptive. First, directional selection favors either an increase or a decrease in a trait’s mean in the population, favoring individuals at one extreme of the phenotypic distribution. For example, the females of the spider Nephila clavipes (Figure 1) are selected for large body sizes as they are able to construct larger webs that capture more prey and can produce more offspring. Second, stabilizing selection is seen in species that have trait values near the population mean with intermediate phenotypes. Species of the orb-weaving spider, Argiope aurantia, capture more prey with intermediate sizes of web decoration versus other individuals with very large or very small decoration. Finally, disruptive selection is a case where both extremes of a trait are advantageous and the intermediate individuals tend to be less common. Females of the spider Gasteracantha cancriformis, prefer males with either very high levels of spines on the abdomens or low levels of spines on the abdomen and often reject those with intermediate levels of spines leading to a bimodal distribution of the number of spines on male abdomens within this species population.
Each of these types of selection is a piece of the driving force of evolution. Previously we have learned that as natural selection acts on a trait and that trait is successfully passed on to subsequent generations, then evolution of the species in question results. But the importance of quantitative traits lies in our ability to measure them and use them to make meaningful measurements about the rate of evolution. Through directional selection we can measure trait means at the start of a generation and the means of the individuals that survive and reproduce. This helps us understand the heritability, or the strength of inheritance, within a population of a species and ultimately we can calculate the rate of evolution based on that. Heritability is one piece of the overall phenotypic variance in a population. The other two sources of that variance is determined by environmental variance, such as climate or available nutrition sources, and gene dominance and epistasis. Gene dominance is where one allele expresses its phenotype over another and in epistasis a gene modifies the expression of another gene.. Natural selection acts on the existing, or standing, genetic variation within a population favoring certain traits or combinations of traits that increase an organism’s fitness. In contrast, populations with low levels of standing genetic variation may be less able to respond to changing environmental conditions, making them more vulnerable to extinction. Selection pressure, environment, and gene function all work simultaneously to determine a specie’s phenotypic traits
Humans have been using artificial selection for thousands of years to breed and improve a variety of plants and animals to aid in agricultural, industrial, and cultural advancement of our species. As a result of artificial selection, we have revealed a handful of general conclusions about phenotypic and trait based selection:
- When a trait is selected, it will evolve
- Traits can evolve beyond the variation that was present in the original population
- Small populations evolve slower than large populations
- Trait selection can cause other traits to be negatively affected
There exists a constant and strong trade-off regarding trait selection and evolution. This idea can often be boiled down to the phrase “there are no free rides in nature.” Traits are correlated. A common example is that with spiders. Large spiders tend to build larger webs while smaller spiders build smaller webs. These correlations between two (out of many) traits contribute to the overall fitness of the spiders and affect their ability to catch prey, mate, and provide specific functions within their environments. Some evolutionary trade-offs can help increase species fitness while other trade-offs balance each other out or may actually create a negative genetic correlation. For example, females in the larger species of spiders have higher fecundity and produce more eggs than small species. One trade-off is that these larger species have longer development times that often result in higher mortality rates.
Some species change their phenotypic expression as a result of their environmental conditions. This is called phenotypic plasticity. Plasticity can be either irreversible or reversible and may affect morphology, physiology, or behavior. Some web-weaving spiders will change the location, size, and shape of their webs in response to weather conditions, prey availability, or to better protect themselves from predators. These types of responses are not because of genetic changes, but rather a direct result of the surrounding environment.
Due to significant advances in DNA technology, we can now determine exactly what portions of a genome affect quantitative traits. Some quantitative traits are affected by a single locus with alleles that have large and significant effects while other quantitative traits are coded for with multiple genes. Understanding exactly which genes, alleles and nucleotides affect traits is imperative to better understand the mechanisms of evolution. Further, finding the quantitative trait loci can assist researchers in finding new therapies for infections that have generated resistance to current drugs.
Genetic drift
Chance is always a factor in evolution. We often like to idealize genomics, natural selection, and evolution as being this uncaring machine that just works. Traits are selected, species reproduce, populations evolve, or populations do not evolve. We learned in previous chapters about trait selection and reproduction and how this drives species evolution. However, what if this was all just a coin flip? What if the color of your hair, the size of a snail’s shell, or the number of leaves on a sunflower plant were all just due to random chance? Randomness and chance are both important pieces of the concept of genetic drift. Genetic drift is a random process causing changes in the frequency of traits within a population. Yes, both natural selection and genetic drift drive species evolution by varying the gene frequency within a population over some defined time. However, it is imperative to point out that genetic drift fluctuates due to chance events whereas natural selection is a process of species adaptation driven by environmental changes. Something that would be difficult to find here in Northern Europe but is nonetheless an accurate example of genetic drift in action is the unfortunate trait of lactose intolerance in humans. Genetic drift was likely an important factor in the initial spread of lactose tolerance. A single individual with the gene for lactose tolerance may, due to chance events, have had many descendants and thus increased that gene frequency over time within certain populations of humans. Although after initial rounds of genetic drift of lactose tolerance in humans, it is likely that positive selection played a role in its proliferation in Northern Europe.
Genetic drift can be particularly important in small populations, where chance events can have a larger impact. As a result, genetic drift can reduce genetic variation within a population, and can even lead to the loss of certain alleles. Other alleles can get fixated, meaning that they become the only allele for one locus present in the population.
There are five central features of genetic drift:
1. Genetic drift is impartial. Allele frequency in a population is just as likely to go up as it is to go down. Remember, genetic drift is due to chance, so alleles that move via genetic drift do so at random. Natural selection on the other hand can favor one allele over another as they are often chosen as a way to increase fitness.
2. Smaller populations are more susceptible to genetic drift. This causes larger fluctuations in allele frequency in smaller populations vs larger ones as the allele shift in larger populations tends to average out based on the larger number of species.
3. Genetic drift causes an overall loss in genetic variation in species populations. Once an allele is fixed within the genetics of a population, it is then the only one that will be passed on to subsequent generations.
4. Genetic drift changes the genomes of identical populations leading to more genetic variation on a larger scale.
5. Alleles can become fixed in a population without any assistance from natural selection.
Genealogy mapping is used to determine the positions of genes on a chromosome and their inheritance patterns. This mapping is used to understand the relationship between genetic variation and the physical traits that they are associated with. We know that different genes have different genealogies. Genes on a chromosome can be viewed similarly to human beings in a country: they have different common ancestors. Those common ancestors may have originated from many different places at many different times. For example, mitochondrial DNA (mtDNA) in humans can be traced back about 125,000 years ago to one of our common ancestors. In fact, mtDNA in all eukaryotic species can be mapped and traced back to a single common ancestor that lived about 2 billion years ago.
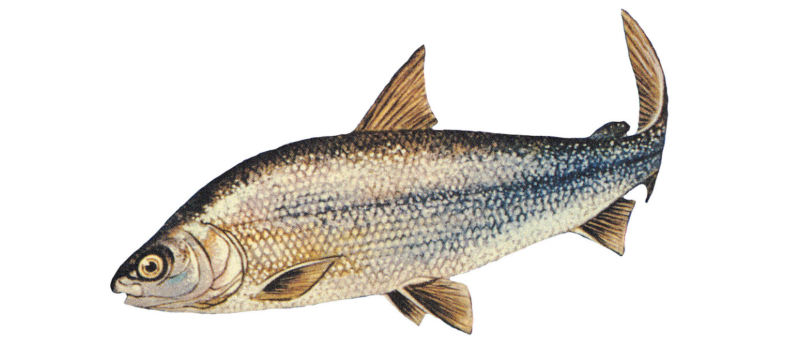
Genetic drift is always at work. However, the strength of that genetic drift is dependent on the effective population size (Ne). Ne is the number of individuals in a that would lose genetic variation at the same rate as the real population. Ne is influenced not only by the number of individuals but also the number that are sexually mature, the strength of random mating between individuals, and the sex ratio. In general, larger populations are less susceptible to drift than smaller populations, but only an infinitely large population would never experience genetic drift. Two types of genetic drift that work strongly on small populations are the bottleneck effect and the founder effect. The bottleneck effect occurs when a population undergoes a dramatic reduction in size, which can lead to a loss of genetic variation due to the random elimination of alleles. The founder effect occurs when a new population is established by a small group of individuals, which can lead to the loss of genetic variation from the original population. For example, the lake whitefish (Coregonus clupeaformis) in the Great Lake region of the North America have suffered major declines in genetic diversity due to intense fishing pressure over the last 100 years. As such, these small populations have been found to have very low genetic diversity likely as a result of being founded by a very small number of individuals (Graham et al., 2022; Stott et al., 2013). These events can be quite damaging to populations as low genetic diversity can lead to species’ being unable to adapt to changing environments.
Genetic drift and natural selection work together to move advantageous mutations through a population. Sometimes they work together to increase the mutation frequency, but occasionally, especially in smaller populations, genetic drift can cause an advantageous mutation to decrease or even be completely removed from a population. Drift can also be responsible for harmful mutations to spread and eventually become fixed. Again, this can be common in small populations that are bottle-necked sometime during their history or in populations with significant inbreeding. Inbreeding load is the weakening of fitness in a small population where harmful genetic mutations become fixed in the genome. Here, inbreeding load is different from inbreeding depression where closely related parents produce offspring with reduced fitness. Florida panthers (Puma concolor coryi) in the southern reaches of Florida have declined into the hundreds and as a result, significant inbreeding load has caused this species to have many health and physical problems including heart defects and lower reproductive success. Unfortunately, genetic drift also causes highly beneficial mutations to become completely lost in a population. This essentially acts as an “evolutionary speed limit” on how quickly species adapt to environmental changes.
Gene adaptation and local adaptation are related mechanisms in evolution referring to different ways in which populations adapt to changing environmental conditions. Gene adaptation refers to the evolution of specific genetic variants. This typically happens through natural selection where beneficial and harmful alleles increase and decrease in frequency, respectively. Local adaptation refers to the evolution of populations that are adapted to their local environment. Local adaptation can involve both genetic and non-genetic factors such as changes in morphology and behavior.
References
Graham, C. F., Boreham, D. R., Manzon, R. G., Wilson, J. Y., & Somers, C. M. (2022). Population structure of lake whitefish (Coregonus clupeaformis) from the Mississippian lineage in North America. FACETS, 7(1), 853-874.
Stott, W., Ebener, M. P., Mohr, L., Hartman, T., Johnson, J., & Roseman, E. F. (2013). Spatial and temporal genetic diversity of lake whitefish (Coregonus clupeaformis (Mitchill)) from Lake Huron and Lake Erie. Adv Limnol, 64, 205-222.