Johan Watz, David Aldvén, Antonis Apostolos Brouziotis, Niclas Carlsson, Eirini Karathanou, Kristine Lund‐Bjørnås, Gustav Lundqvist, Martin Österling, John J. Piccolo and Olle Calles recently published the paper “Social behaviour of European grayling before and after flow peaks in restored and unrestored habitats” in the journal River Research and Applications.

In the abstract of the paper the authors write:

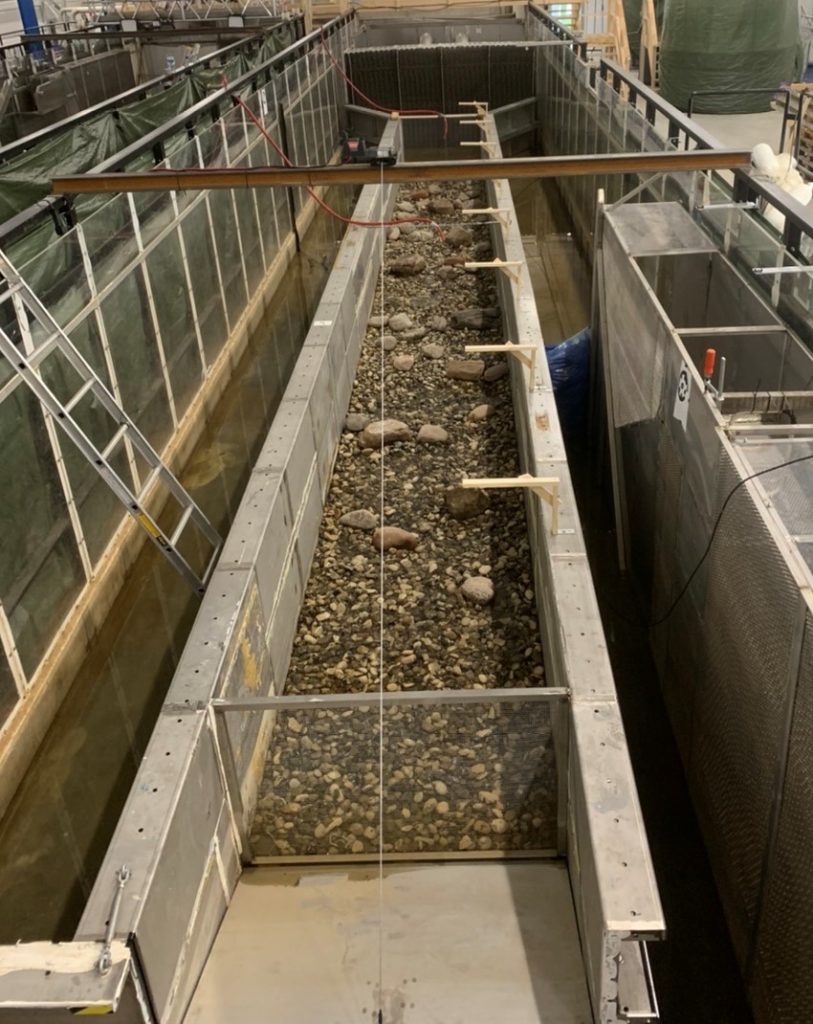
“Cost‐effective implementation of fish‐friendly hydropower flow operation and habitat restoration measures require an understanding of their effects on fitness‐related behaviours of stream fish. Here, we investigated how changes in flow and bottom structure influence the social behaviour of European grayling, using large experimental flumes (700 L s−1), with and without added boulders (i.e., restored and unrestored habitat). Grayling increased their distance to nearest neighbour at the start of flow ramping up and after a flow peak compared to stable base flow. At the start of ramping up the flow, grayling made less position changes (movements >1 m) than at stable base flow and after a flow peak. In the unrestored habitat, the proportion of time grayling spent actively swimming was lower before a flow peak than it was both at the start of ramping up the flow and after the peak, an effect not found in the restored habitat. In addition, we compared two static flows, and habitat restoration mediated their effect on distance to nearest neighbour. Grayling in the restored habitat were positioned closer to each other in the low (~10 cm s−1) than in the intermediate static flow (~40 cm s−1), whereas in the unrestored habitat, grayling showed the opposite pattern. Moreover, grayling reduced their number of position changes in the intermediate static flow, which was reflected by a reduction in active swimming. Stomach analysis after the trials revealed that foraging success was higher in variable than in the stable flow treatment. These results show that flow magnitude, flow changes and instream structure play important roles in the behaviour of stream fishes.”

The paper is available open access on the journal website.

Johan Watz (left), together with Eirini Renata Karathanou and Antonis Apostolos Brouziotis.

As part of the Gullspång salmon and -trout monitoring program, a group of people from the management group, Gammelkroppa Lax and Jyväskylä University/Fortum perform redd surveys in the river every year in early December. The salmon and trout in the Gullspång River spawn fairly late in the season, first trout in October-early November and then salmon in November until around the beginning of December.

This year I was invited to assist in the redd surveys, which I of course said yes to! Any chance to learn more about the Gullspång salmon and -trout is valuable for the model I’m making. Plus, it’s nice to get out of the office, even when the temperature is close to zero. And it’s also very inspiring to meet other people who are studying the Gullspång salmonids.


Lilla Åråsforsen. With sunrise at around 8:30 and sundown at 15:30, we had to be efficient to cover the three areas (about 6.4 hectares) in the precious daylight hours the four days.


So, we started by the Årås bay (Åråsviken) on Tuesday, and slowly worked our way upstream. With layers upon layers (upon layers…etc.) under our waders, and thick, wadded rubber gloves we walked gracefully around in the three spawning areas – Lilla & Stora Åråsforsen and Gullspångsforsen- to look for anything that could be a fish-made structure in the gravel beds. Sometimes we had redds that looked like textbook examples of redds, other times they didn’t look like anything. To confirm or disprove that it was an active redd, we did some careful digging in the pit itself to see if it contained at least two live eggs. The females often do some test diggings before the “real deal”.

We marked confirmed redds with conspicuously colored stones so that they can be found again in the spring; their location was also mapped with a GPS. Initially, we started with Finnish marking stones, but to our slight surprise they ran out (see why further down). We therefore had to settle with slightly lighter Swedish stones the last few days. Sadly, Norway was not represented with any stones (but we’ll see next year).

We also took measurements of the dimensions of the redds, as well as the depth and velocities along the gradient between start of pit and end of tail. I quickly took the role of propeller lady, taking the flow velocity measurements with NRRV’s OTT meters. It was interesting to see how much higher the velocity generally was in the tail compared to in the pit.


Horseshoe-formed tail of a large redd in Lilla Åråsforsen rapids marked with a white-painted and numbered stone. The marking stones were bought from a local stone dealer in Finland and brought to Gullspång.


I’ve saved the best for the end: the reason why we kept running out of marking stones was that we counted a record number of redds this year! We found redds also where they usually are not found, in total around 190 of them! It’s a careful victory, because we don’t yet know how many of them are salmon respective trout redds. But it was a nice early Christmas present, and I’m glad I joined!

/Kristine Lund Björnås


Learn more:

Management report on the monitoring results on Gullspång salmon and –trout in 2017:

http://extra.lansstyrelsen.se/vanern/Sv/publikationer/2018-2020/Sidor/Gullsp%C3%A5ngs%C3%A4lven_2017.aspx


Salmon females design their redds in a sophisticated way to increase velocities and dissolved oxygen to the egg pockets as shown with a 3D fluid dynamic model:

Tonina, D. & Buffington, J.M. (2009). Doi:10.1139/F09-146